Edit chart
Loading graph
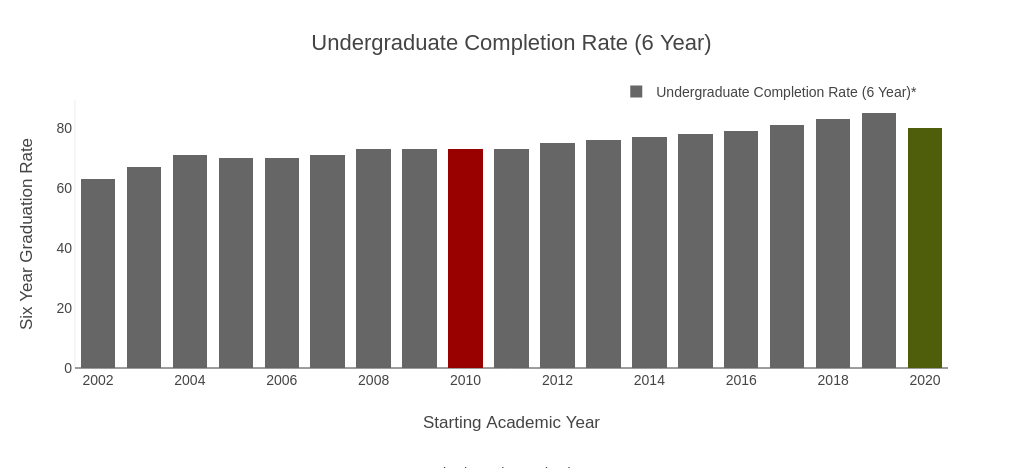
Provostncstate's interactive graph and data of "Undergraduate Completion Rate (6 Year)" is a stacked bar chart, showing Undergraduate Completion Rate (6 Year)*, Baseline, Goal; with Starting Academic Year in the x-axis and Six Year Graduation Rate in the y-axis.. The x-axis shows values from 2001.5 to 2020.5. The y-axis shows values from 0 to 89.47368421052632. This visualization has the following annotation: *Data is shown by graduation year.